The COVID-19 lockdown in Wuhan, China, resulted in a 63% reduction in nitrogen dioxide concentrations, according to our new research. We have calculated that this drop in air pollution may have prevented up to 496 deaths in Wuhan, 3,368 in Hubei province and 10,822 in China as a whole. The potential deaths prevented may even outweigh the official Chinese death toll from COVID-19 itself which stands at 4,633.
That is not to imply the pandemic has yielded net benefits to China. The purpose of the analysis we carried out was to show that a policy as stringent as a lockdown has far-reaching implications which extend well beyond the intended purpose of disease control.
As many shops and businesses closed, industrial activity and vehicle use in cities across the world fell dramatically and reports emerged of pollution levels being considerably below those experienced in “normal” conditions. Such improvements in air quality and the likely associated health benefits have raised the prospect of an unlikely silver lining to the otherwise overwhelmingly negative impacts of the pandemic.
Which pollutants have actually fallen?
Studies show that concentrations of many pollutants are influenced by local weather conditions, making it difficult to compare emission levels with previous years or contemporaneously with other cities. Similarly, if pollution levels are changing year-on-year, comparisons with previous years may be misleading. So what are the likely health benefits of any reductions in pollution?
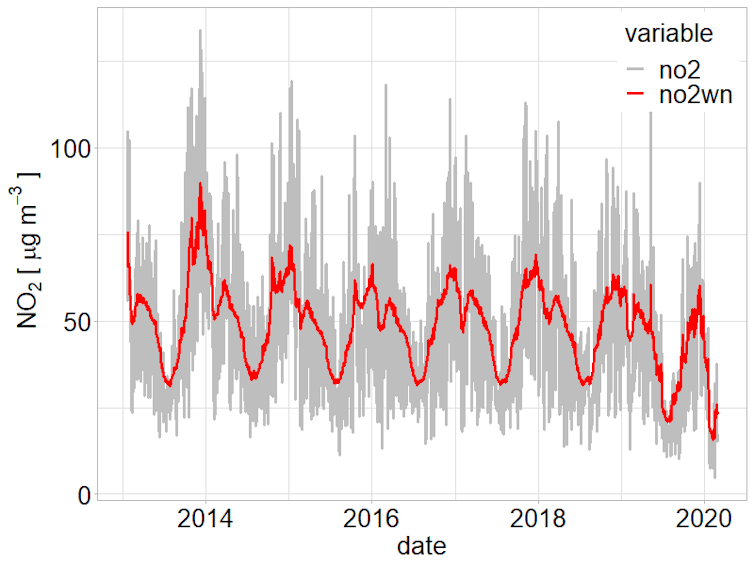
We used a recently developed predictive machine learning method (a type of data analysis that identifies patterns in data and learns from them) to strip out the effects of weather conditions (wind speed, wind direction and temperature significantly affect local pollution concentrations). The graph below shows the large difference between observed nitrogen dioxide (NO₂) concentrations and “weather-normalised” concentrations (in red), from which the effect of weather conditions has been removed.

Author provided
We then compared the de-weathered pollution concentrations to a control group generated from 29 similar sized cities in China using an augmented synthetic control method. This technique weights pollution concentrations in the control group cities in such a way that they match pollution trends in Wuhan pre-lockdown. Any divergence in pollution trends between Wuhan and the weighted control group post-lockdown can then be attributed to the lockdown itself.
Wuhan is a city of approximately 11.1m people and is the largest of the 17 cities in Hubei province. It was locked down at 10:00 BST on January 23. Other large cities in China did not lock down for at least another two weeks, providing us with a set of 29 cities that form our control group. These allow us to identify how much pollution fell by in Wuhan, relative to the control, over the first two weeks of the lockdown.
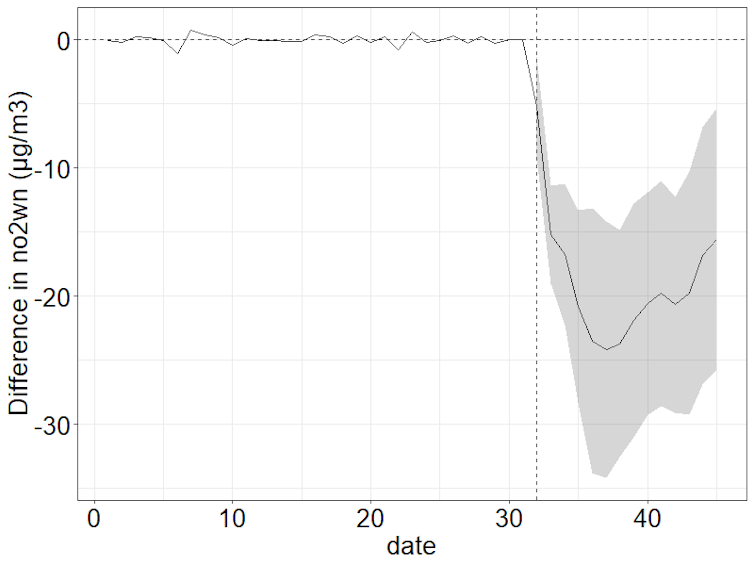
The results show that Wuhan experienced a significant reduction in concentrations of NO₂ and particulate matter (PM10) – sometimes known as floating dust – as a result of the lockdown. The second graph shows the difference between NO₂ concentrations in Wuhan and the synthetic control group before and after the lockdown.

Author provided
Concentrations of NO₂ fell by as much as 24 micrograms per cubic meter (µg/m3) during the lockdown period – a reduction of 63%. Floating dust concentrations fell by approximately 22 micrograms per cubic meter, albeit for a shorter four to five day period – a reduction of 35%. These reductions brought NO₂ concentrations from a level very close to the World Health Organization (WHO) safe limit to well within the limit (although PM10 levels remained above the safe threshold). No significant reductions in concentrations of sulphur dioxide (SO₂) or carbon monoxide (CO) were found, showing that not all aspects of air quality improved.
Lives saved?
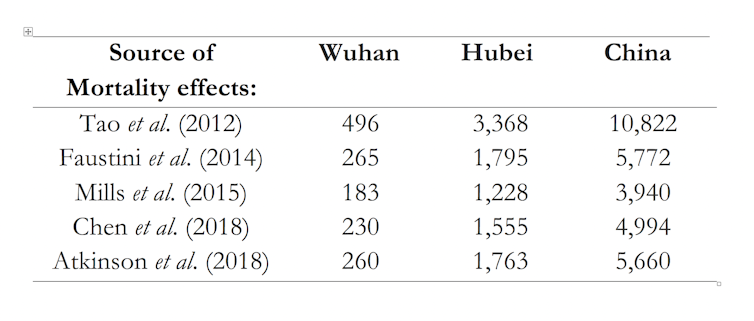
To calculate the deaths prevented due to the reduced nitrogen dioxide we drew upon mortality effects from a number of published papers, going back to 2012, which identify the increased risk of mortality associated with an increase in NO₂ of 10 micrograms per cubic metre. We combined these estimates with the monthly mortality rate in Wuhan, Hubei province and China – as well as the population level in each of those regions – and calculated how much lower mortality would have been over the full lockdown as a result of the estimated reduction in pollution.
While our analysis indicates that pollution fell by up to 24 micrograms per cubic metre for the first two weeks of the lockdown, we assumed that over the full duration of the lockdown it fell by an average of 20 micrograms per cubic meter. Our findings suggest the lockdowns may have prevented up to 496 deaths in Wuhan, 3,368 in Hubei province and 10,822 in China as a whole.

Author provided
It is important to understand how improved air quality, as a result of the lockdown, may have lessened the strain on health services within cities. Air pollution in China regularly exceeds WHO guidelines and, in the absence of these pollution reductions, hospital admissions would almost certainly have been even higher. There have also been reports that exposure to pollution may increase COVID-19 mortality, raising the possibility that Wuhan’s death rate may have been even higher if the lockdown had not improved air quality.
While our analysis focuses on China alone, it appears that many countries have experienced significant reductions in pollution as a result of COVID-19 lockdowns and, it seems reasonable to assume, have also enjoyed health benefits due to the cleaner air. In the UK, concentrations of NO₂ regularly exceed WHO guidelines although less frequently and by a smaller magnitude than in China. As a result, the clean air health benefits in the UK are likely to be smaller in magnitude than those estimated for China.![]()
Matt Cole, Professor of Environmental Economics, University of Birmingham; Bowen Liu, Doctoral researcher of Environmental Economics, University of Birmingham, and Robert Elliott, Professor of Economics, University of Birmingham
This article is republished from The Conversation under a Creative Commons license. Read the original article.


